Sick of Long Commutes? These Cities Have the Worst Traffic
No matter how you do it—by car, rail, or foot—commuting can be a hassle.
And now that Labor Day has come and gone, it’s back to the grind…at least for most of us. With the diversification of the workforce and the expansion of technology, working outside of a traditional office context has never been easier—or more common. The number of employees who telecommute (most commonly working from home) has grown by 115% in the past thirteen years, according to data from the U.S. Census Bureau’s American Community Survey (ACS). Despite this, the vast majority of employed Americans still have some sort of commute to and from work each day.
It doesn’t help that many of the most populous cities in the country have notoriously high levels of traffic congestion, making commutes all the more maddening for motorists stuck in standstills. Ideally, we’d all be commuting in a “normal,” bearable level of traffic flow—TomTom, a navigation technology company that indexes traffic congestion levels, calls this a “free flow” condition, or a traffic situation that is unencumbered by traffic congestion. But the level of traffic congestion in the worst cities can add roughly 25% to 45% of extra time to any given commuting trip.
Furthermore, while it may seem like commuting only leads to a few premature gray hairs and elevated stress levels, the time spent in traffic, sitting on the train, or even bicycling to work really does add up: 26.1 minutes per trip is the national average, according to the ACS. That’s 52.2 minutes per day, or nearly 4.5 hours per week. For someone working 50 weeks annually, commuting alone sucks about nine whole days out of each year.
You might think that your town or city has the worst commutes in the nation—after all, some cities have inordinately high traffic congestion during peak commute times; others have subpar or not fully realized public transit options; some, unfortunately, have both. To see which cities really do have the worst traffic for commuters, the data scientists at Insurify analyzed statistics from TomTom’s Traffic Index, which measures global traffic congestion, and the U.S. Census Bureau’s 2012-2016 American Community Survey 5-Year Estimates.
Here’s what they found.
- Coastal commutes. In terms of traffic congestion, the nation’s highest-ranking cities were mostly large urban centers on the Atlantic, Pacific, and Gulf coasts. Only one Midwest city—Chicago—was ranked among the top 20.
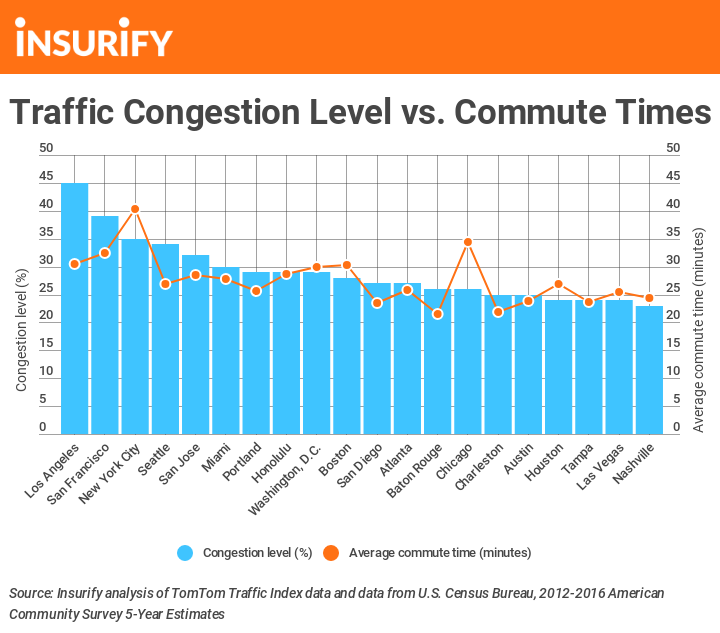
- Congestion vs. commute times. The data scientists ran a correlation analysis of the 80 American metropolitan areas that are covered on TomTom’s traffic index, and found that there is a strong correlation between traffic congestion and average commute times. (The corresponding values for the top 20 cities with the worst traffic are represented on the second infographic below.) This correlation suggests that higher levels of traffic congestion significantly lengthen commute times for the average commuter.
- Forget roads. What about rails? While traffic congestion is one major impediment to daily commutes, a city’s commuting profile depends on its public transit options, too. Larger cities like New York and Los Angeles have comparatively higher rates of public transit ridership, precisely because they are so populous and must accommodate a higher number of commuters. Yet in many of the mid-sized cities analyzed, the proportion of regular public transit is currently in the single digits. Although congestion levels are relatively lower in these cities, a higher proportion of their commuters opt to drive to and from work, making these areas more known for nasty driving commutes than public transit woes. Fortunately, some are exploring new ways to expand public transit systems and encourage ridership as a result of their freeways’ congestion.
Methodology
The data scientists at Insurify, an insurance quote comparison website, compiled data related to commuting times and behavior for the top 20 cities with the highest levels of traffic congestion. Cities were ranked by congestion level, courtesy of TomTom’s Traffic Index, which measures traffic congestion on a global level (all credit for this data goes to TomTom International BV). “Congestion level” refers to the increase in overall travel times, when compared to “free flow” uncongested traffic, across an entire year. For instance, a congestion level of 25 percent would suggest that the average trip, anywhere in the city, at any time, would take 25 percent extra travel time compared to a free flow situation. The data on average commute times and proportions of the working population using public transit or walking to work is from the U.S. Census Bureau’s 2012-2016 American Community Survey 5-Year Estimates.
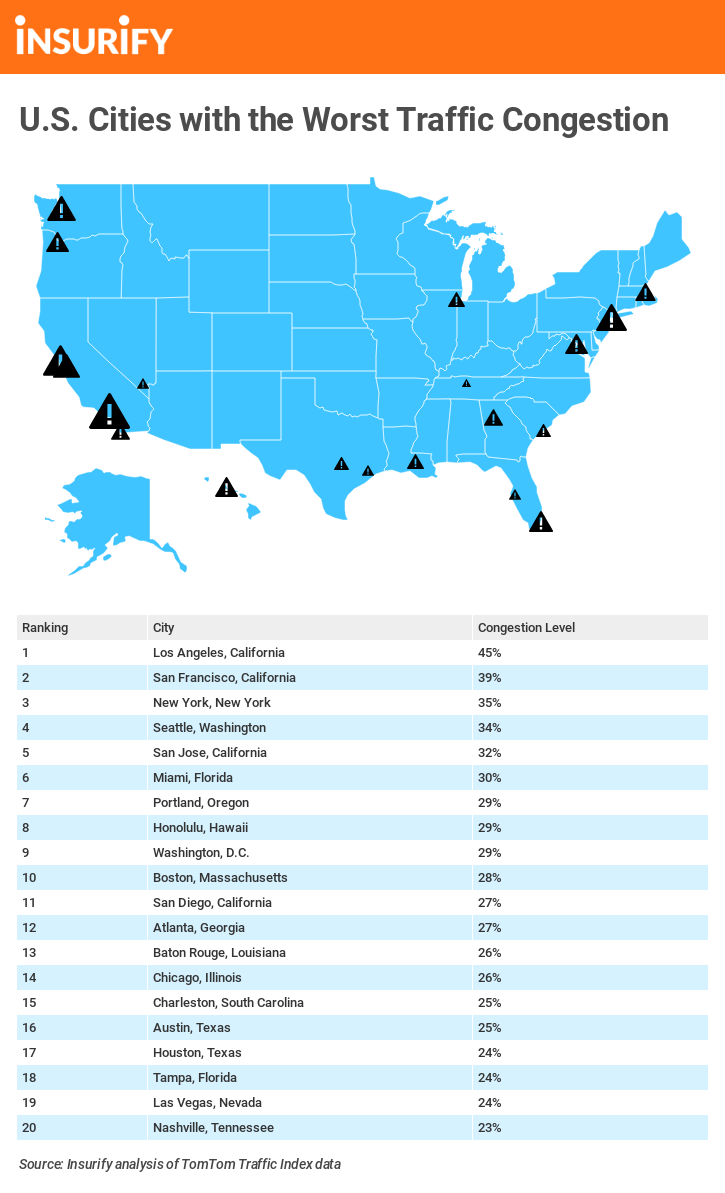
Top 20 Cities with the Worst Traffic
 Credit: Shutterstock / ESB Professional
20. Nashville, Tennessee
- Congestion level: 23%
- Average commute time: 24.3 minutes
- % of commuters using public transit: 2.2%
- % of commuters who walk to work: 2.0%
Recent reporting by the Nashville Area Chamber has shown that half of the Middle Tennessean workforce must cross county lines to get to work every day, given the Nashville area’s prevalence of large corporate employers. Since a minimal amount of Nashville citizens commute to work by alternative means of transportation, it’s not a shock that this city sees the highest levels of traffic congestion in the East South Central region of the U.S.
 Credit: Shutterstock / f11photo
19. Las Vegas, Nevada
- Congestion level: 24%
- Average commute time: 25.4 minutes
- % of commuters using public transit: 4.3%
- % of commuters who walk to work: 1.8%
Commuting in Las Vegas is definitely a gamble. While millions work and live in Clark County, almost all of them have to negotiate their commutes around the tourist-heavy area. A proposed initiative would put a light rail system or a similar bus system along the Maryland Parkway, running nearly nine miles from McCarran International Airport to downtown Las Vegas.
 Credit: Shutterstock / Sean Pavone
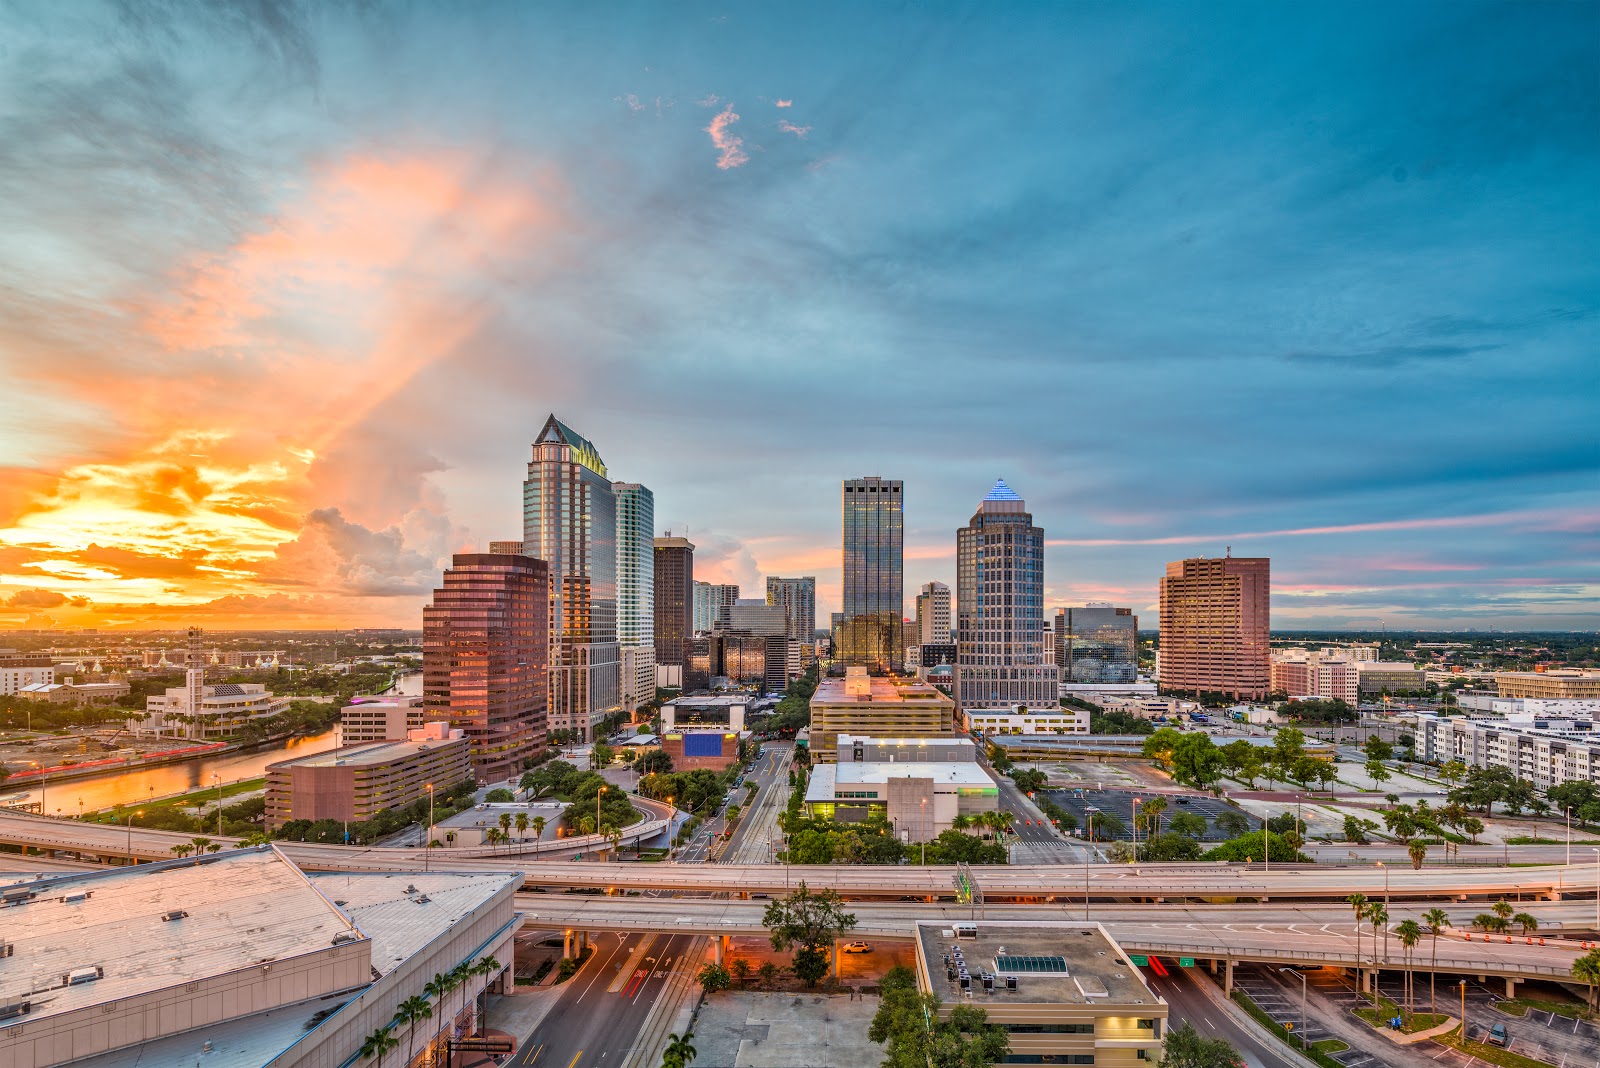
18. Tampa, Florida
- Congestion level: 24%
- Average commute time: 23.6 minutes
- % of commuters using public transit: 2.5%
- % of commuters who walk to work: 2.6%
While there isn’t a dearth of non-driving transportation options in the greater Tampa area, regular commuters in the area are faced with lengthy driving commutes (the second worst in the entire state of Florida). Recent reporting has suggested that even though traffic congestion has been getting worse, commuting times have improved for Tampa-based workers.
 Credit: Shutterstock / f11photo
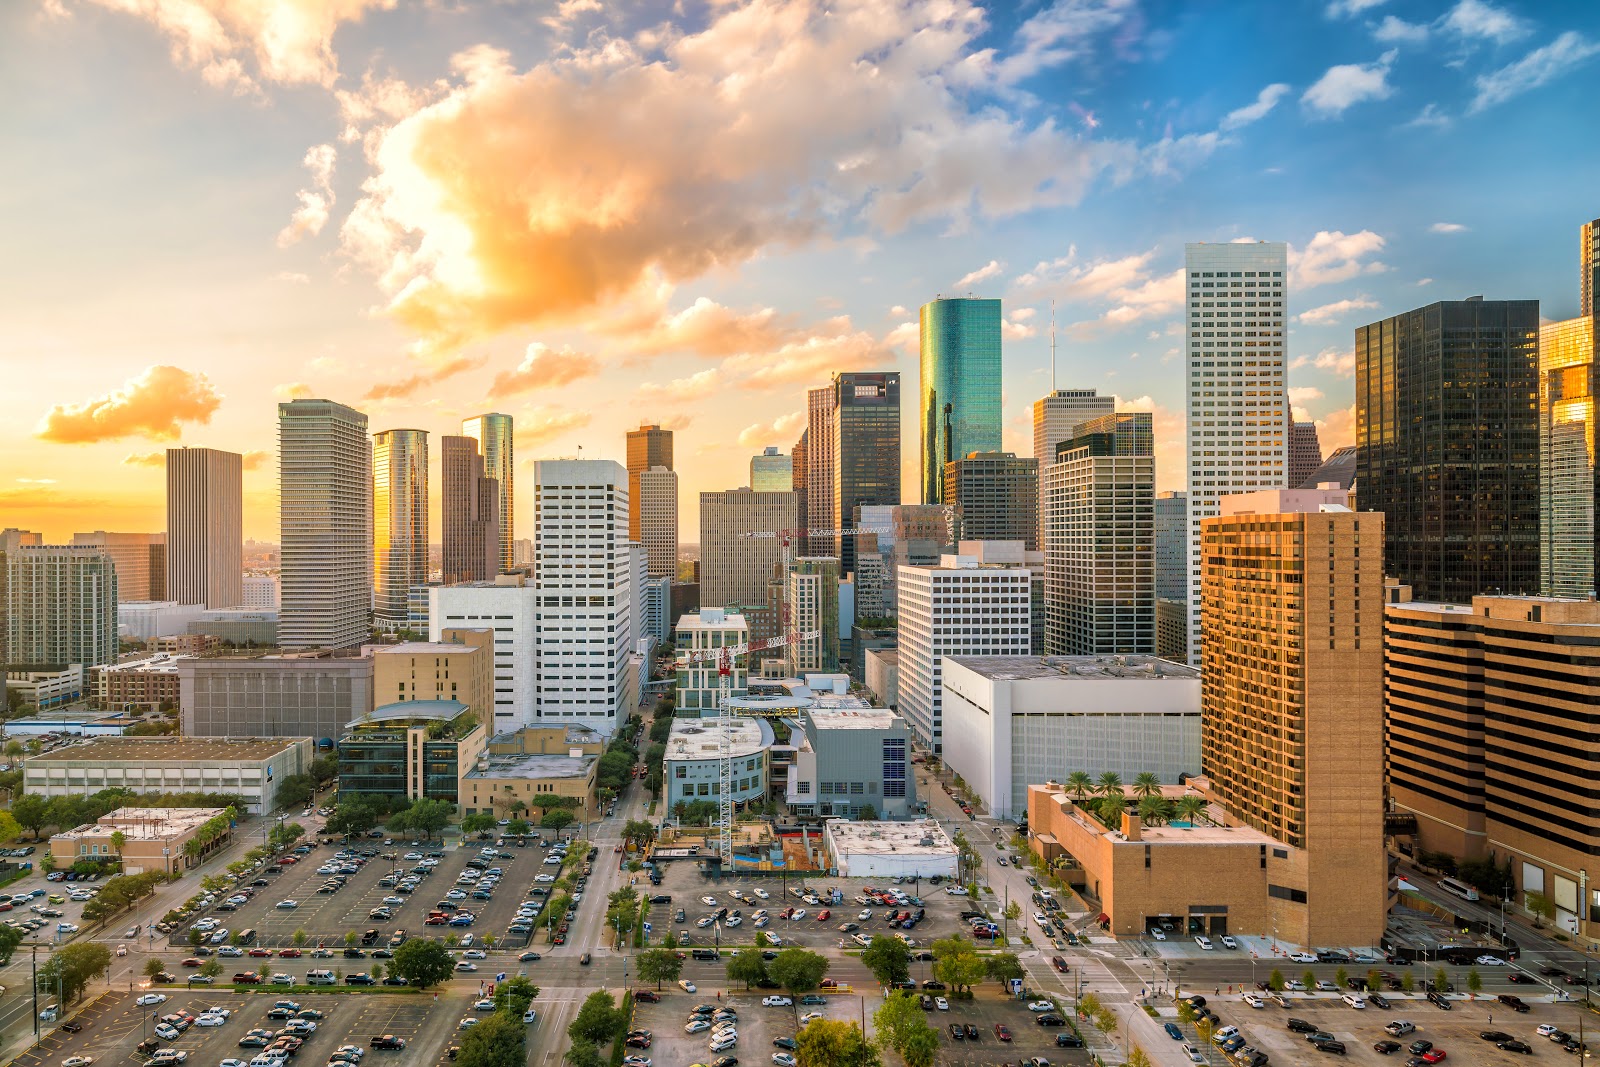
17. Houston, Texas
- Congestion level: 24%
- Average commute time: 26.8 minutes
- % of commuters using public transit: 4.0%
- % of commuters who walk to work: 2.1%
Houston’s METRO has low regular ridership. Alternatively, most commuters drive to and from work in this urban area. But Houston’s rapid population growth has local officials planning for substantial expansions to commuter bus service.
 Credit: Shutterstock / Roschetzky Photography
16. Austin, Texas
- Congestion level: 25%
- Average commute time: 23.8 minutes
- % of commuters using public transit: 4.0%
- % of commuters who walk to work: 2.3%
Like their fellow Texans in Houston, commuters in the Lone Star State’s capital city largely drive to and from work. However, their commute time, on average, shaves three minutes off of that of Houston. The city’s public transit system, CapMetro, is actively seeking federal funding for the primary purpose of easing traffic congestion.
 Credit: Shutterstock / f11photo
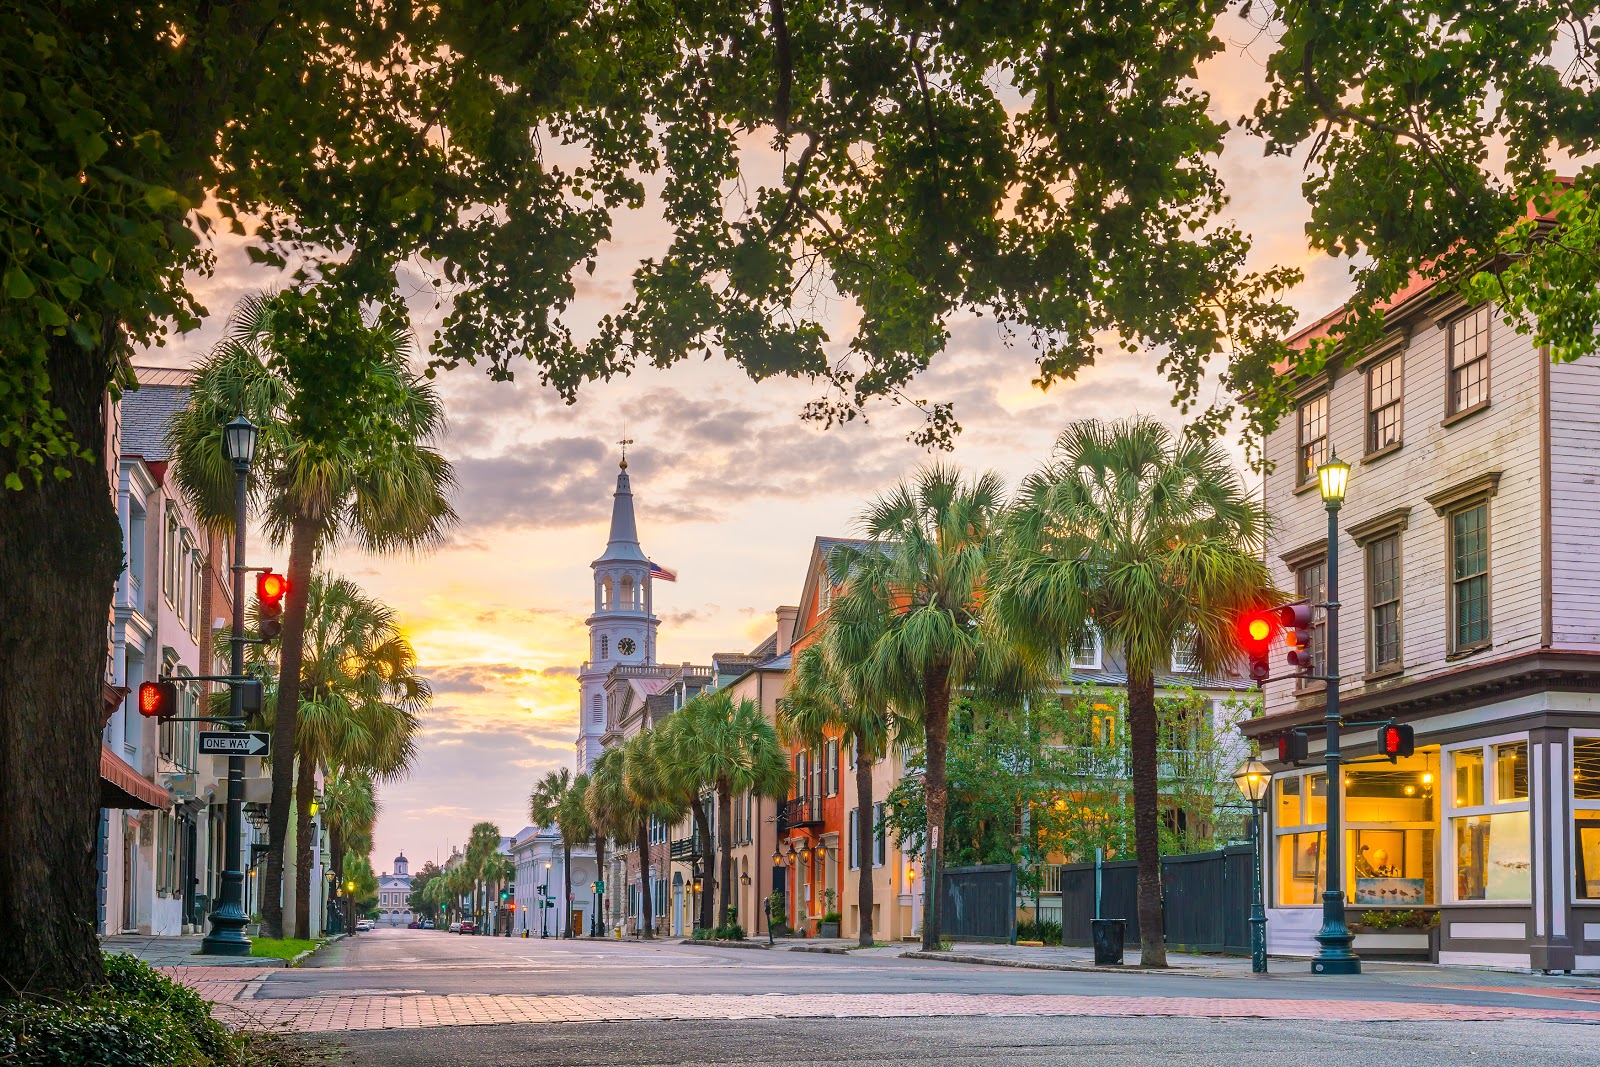
15. Charleston, South Carolina
- Congestion level: 25%
- Average commute time: 21.9 minutes
- % of commuters using public transit: 1.7%
- % of commuters who walk to work: 6.0%
This mid-sized city sees a vast majority of commuters traveling by way of personal vehicles, and has the lowest number of commuters using public transit on this list. The South Carolina Department of Transportation is currently considering ways to improve commuting times, which disgruntled residents have noted are steadily climbing—they are even eyeing initiatives to actively promote ridesharing and telecommuting.
 Credit: Shutterstock / marchello74
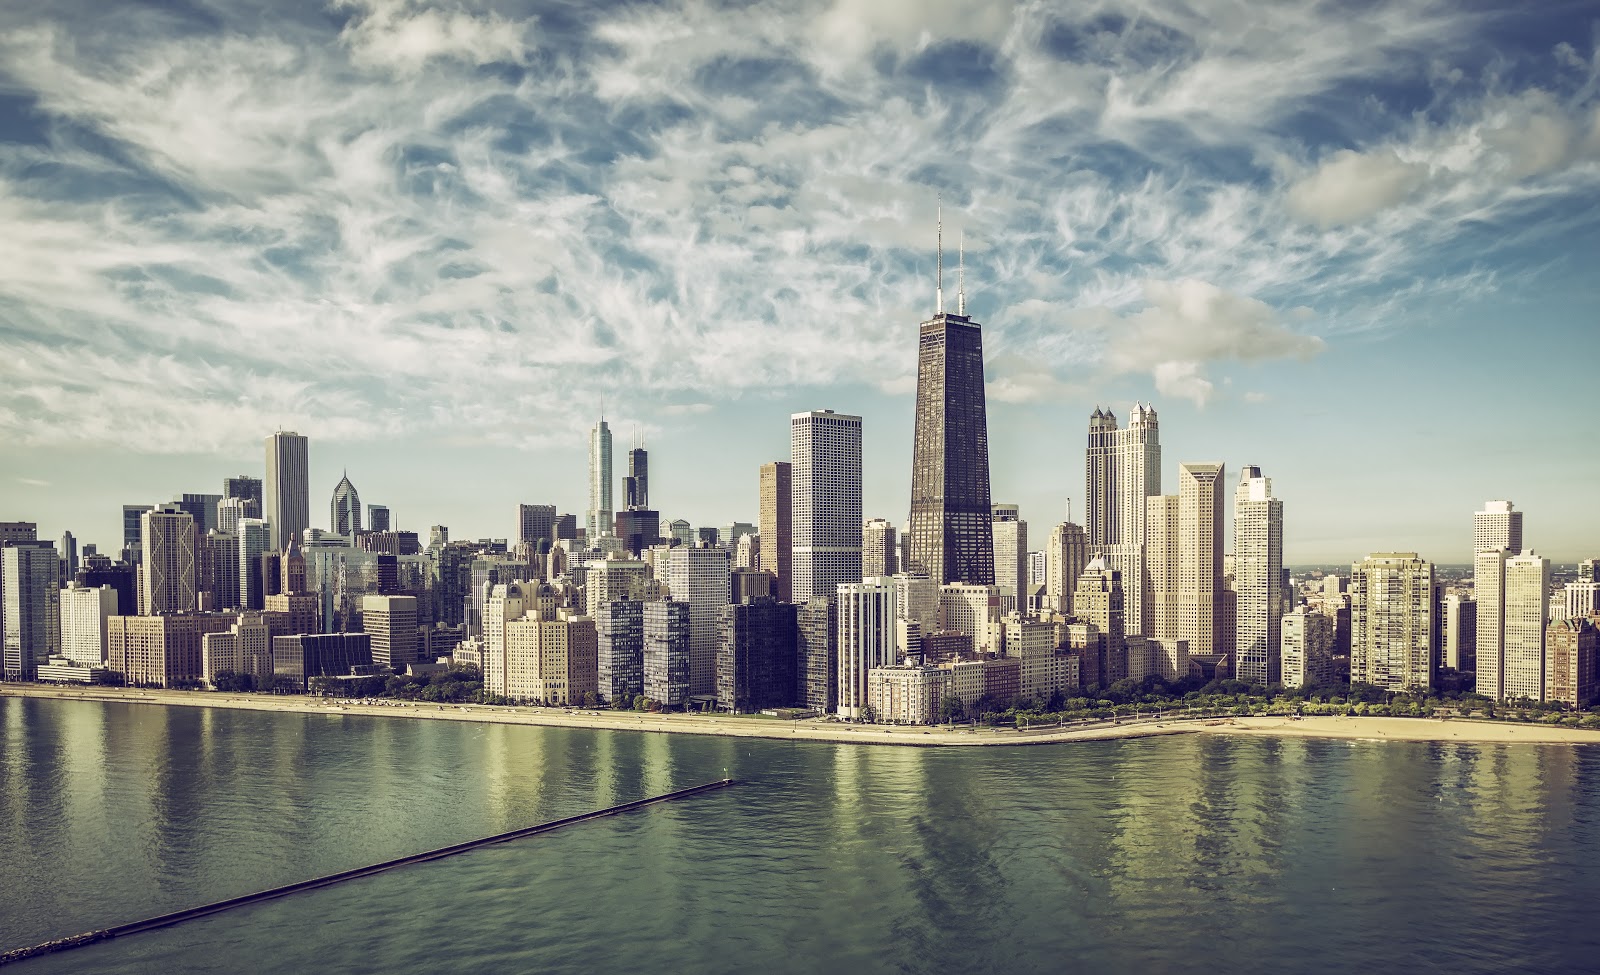
14. Chicago, Illinois
- Congestion level: 26%
- Average commute time: 34.4 minutes
- % of commuters using public transit: 27.8%
- % of commuters who walk to work: 6.7%
The Windy City is the third most populous city in America, but its road congestion levels are markedly lower than those of far smaller locales. It is the only city in the midwest that ranks among the top 20 with the worst traffic congestion.
 Credit: Shutterstock / travelview
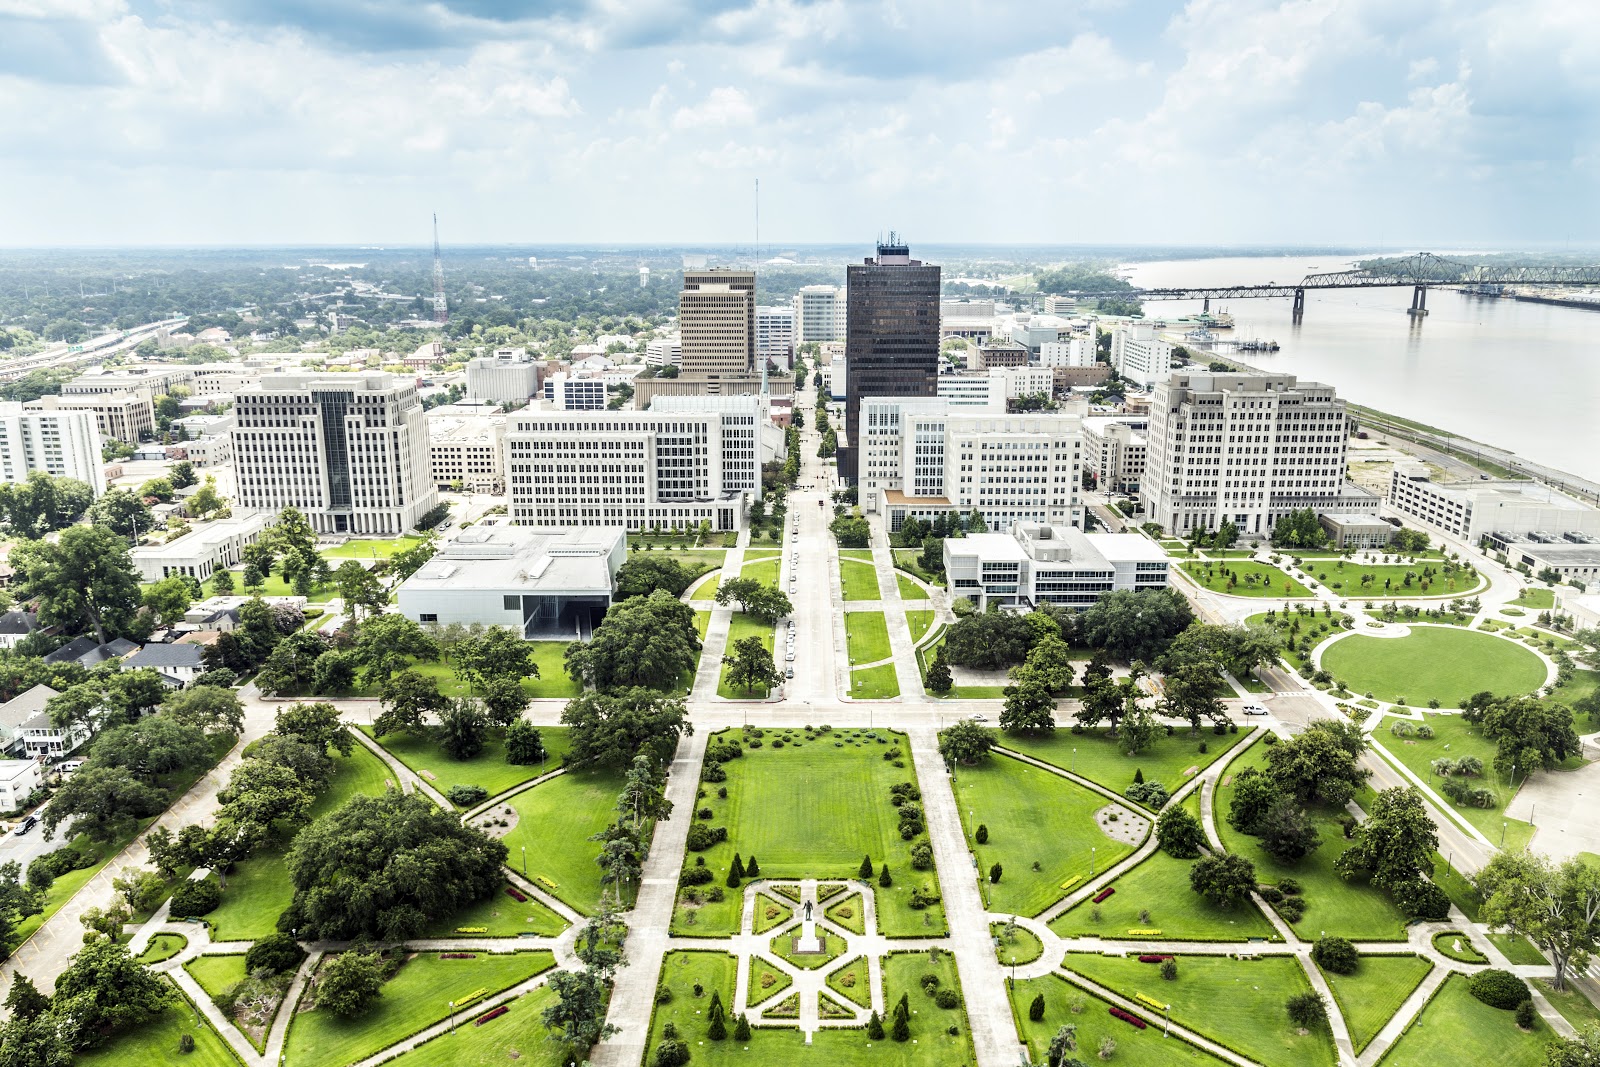
13. Baton Rouge, Louisiana
- Congestion level: 26%
- Average commute time: 21.5 minutes
- % of commuters using public transit: 2.9%
- % of commuters who walk to work: 3.3%
Baton Rouge commuters don’t have an egregious commute—in fact, it’s the shortest average commute time on this list—but commuters are not strangers to sitting in traffic on I-10. The Baton Rouge Metro Council recently agreed to pay an engineering firm to study and improve local transit.
 Credit: Shutterstock / ESB Professional
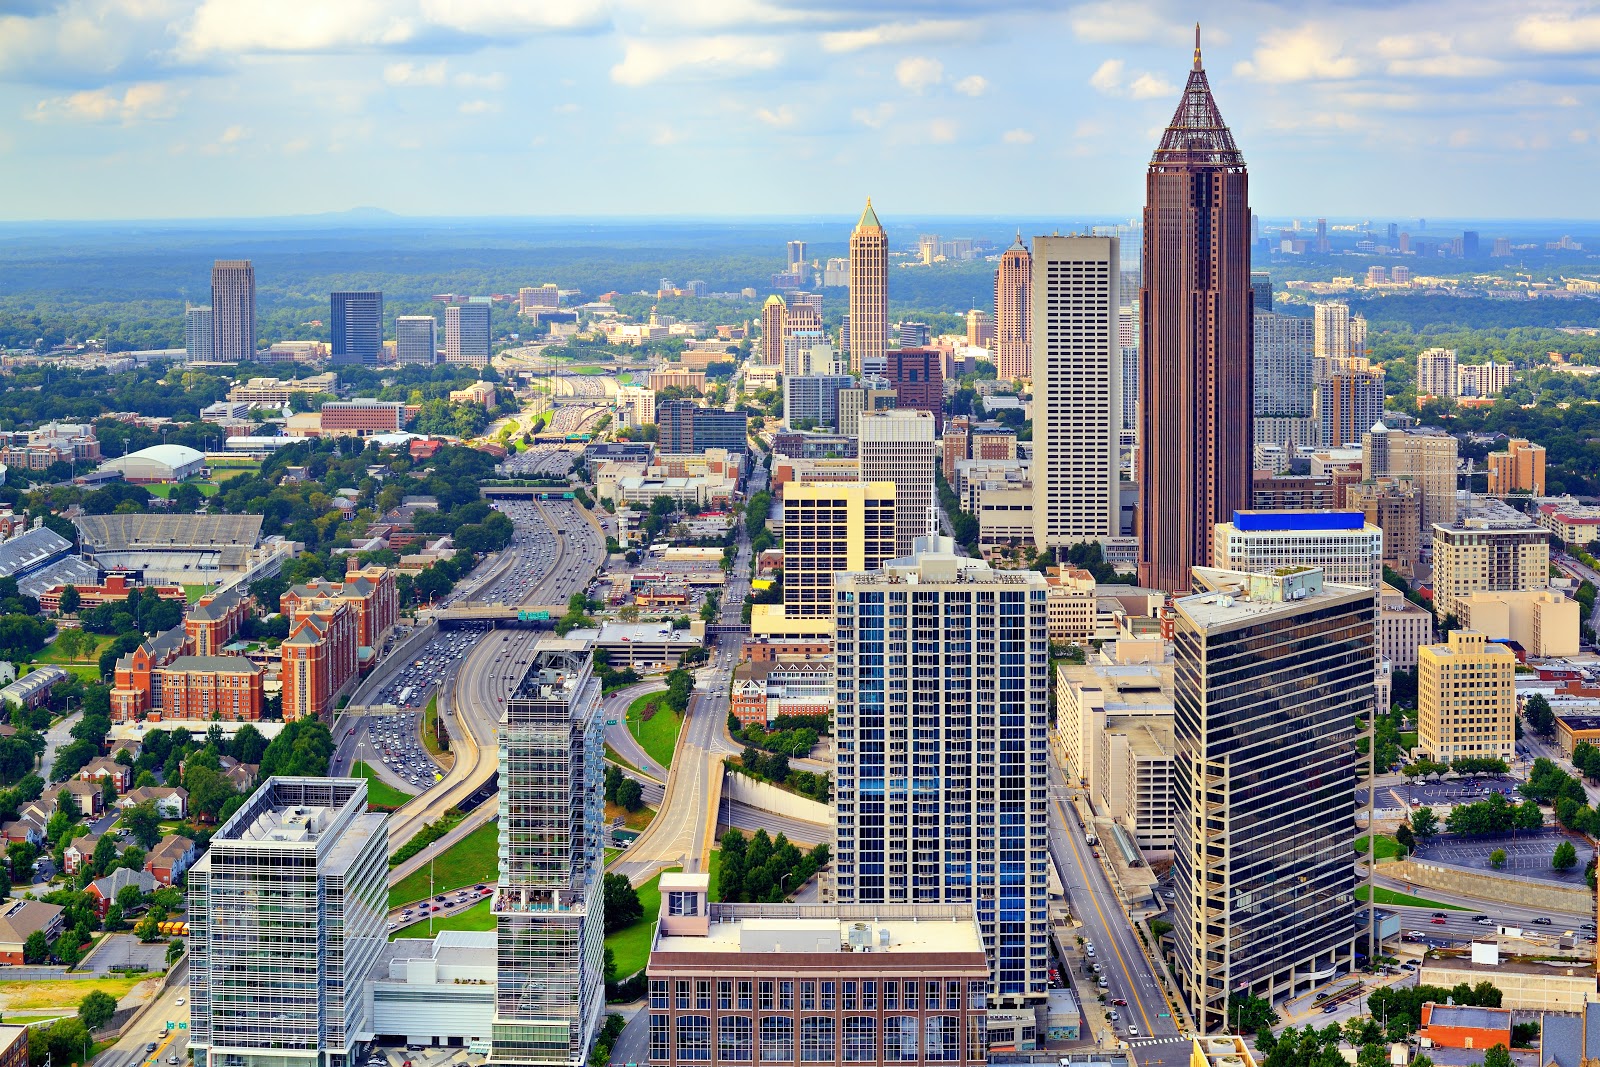
12. Atlanta, Georgia
- Congestion level: 27%
- Average commute time: 25.8 minutes
- % of commuters using public transit: 10.0%
- % of commuters who walk to work: 4.6%
While a tenth of Atlanta’s workers currently rely on public transportation, the city’s system is a divisive talking point. Plans to expand public transit are a go, but suburban and rural residents of the greater Atlanta area are concerned it will compromise the character of these communities. But with traffic congestion levels at an average of 27%, expanded transit options are projected to ease traffic on local freeways.
 Credit: Shutterstock / Dancestrokes
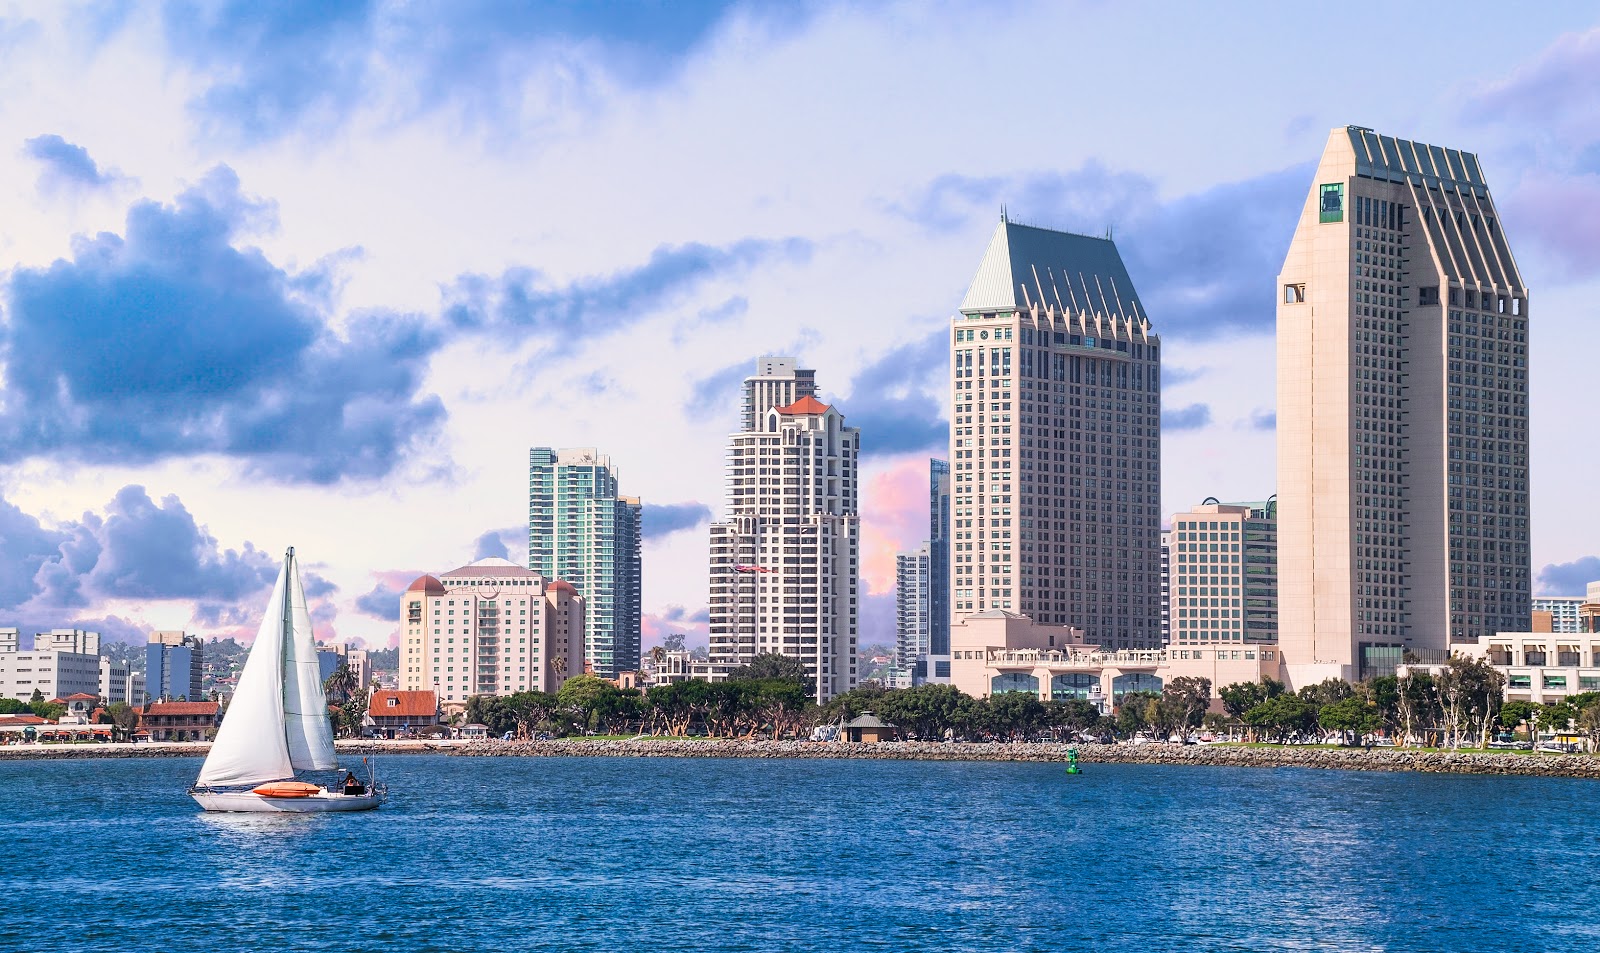
11. San Diego, California
- Congestion level: 27%
- Average commute time: 23.5 minutes
- % of commuters using public transit: 3.9%
- % of commuters who walk to work: 3.1%
With the fourth most congested roads in California, San Diego’s roads are not as egregious as other Californian urban areas. While this SoCal city doesn’t have a particularly robust public transportation system, there is a ray of hope for some commuters: South Bay Rapid bus service recently launched, connecting downtown San Diego to eastern Chula Vista. The expansion project cost in the millions, and while beneficial to commuters, it has been met with disdain from environmental activists who are doubtful of its energy efficiency.
 Credit: Shutterstock / Sean Pavone
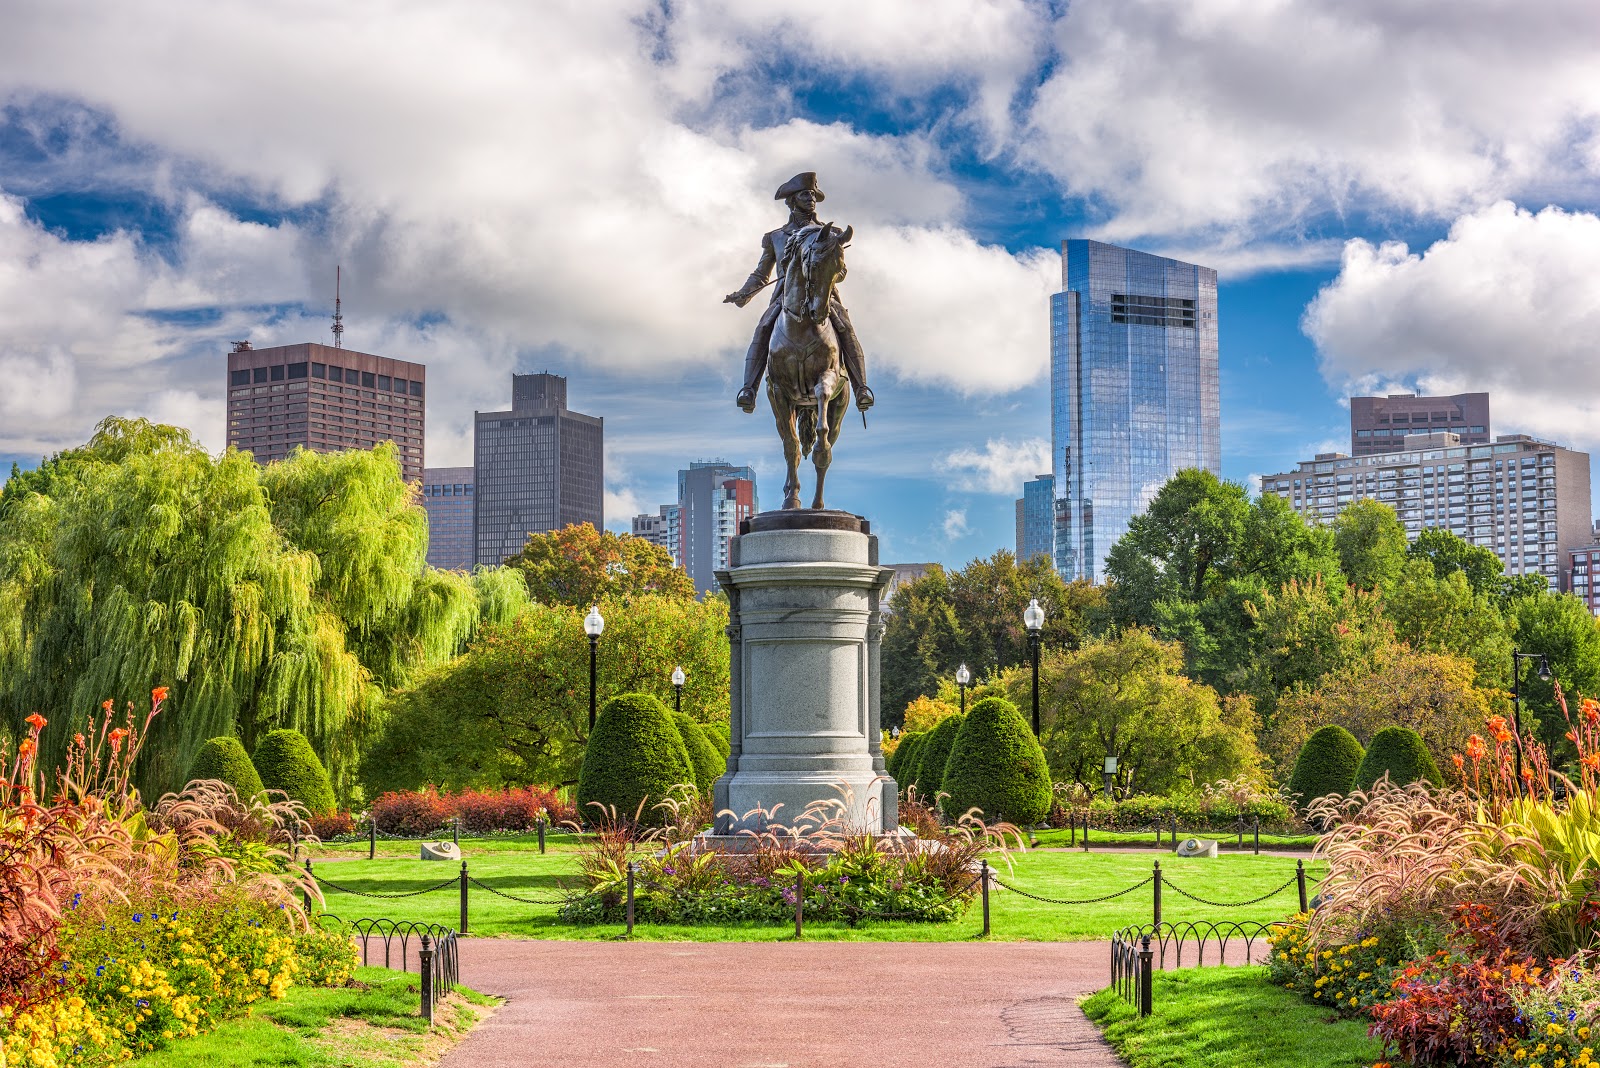
10. Boston, Massachusetts
- Congestion level: 28%
- Average commute time: 30.3 minutes
- % of commuters using public transit: 33.6%
- % of commuters who walk to work: 14.8%
Bean Town residents are more or less fed up with the increasingly long commutes in the area, according to a Boston Globe investigation earlier this year. Living and working in a city as compact as Boston (with nearly 14,000 people per square mile!) certainly has its downsides—with the average commuter spending an hour a day getting to and from work. But a healthy swath of Bostonians choose to commute on foot: of the cities on this list, Boston has the highest proportion of commuters who walk to and from work.
 Credit: Shutterstock / Sean Pavone
9. Washington, D.C.
- Congestion level: 29%
- Average commute time: 29.9 minutes
- % of commuters using public transit: 36.8%
- % of commuters who walk to work: 13.3%
A healthy amount of the workforce in the nation’s capital rely on public transportation to get them to and from their jobs. In fact, if the district were a state, it would clock in as the state with the highest proportion of daily public transit riders. The district’s public transit system is the Washington Metro, which administers over 179 million rail trips and 123 million bus trips per year, according to the most recent available data from the Washington Metropolitan Area Transit Authority.
 Credit: Shutterstock / Izabela23
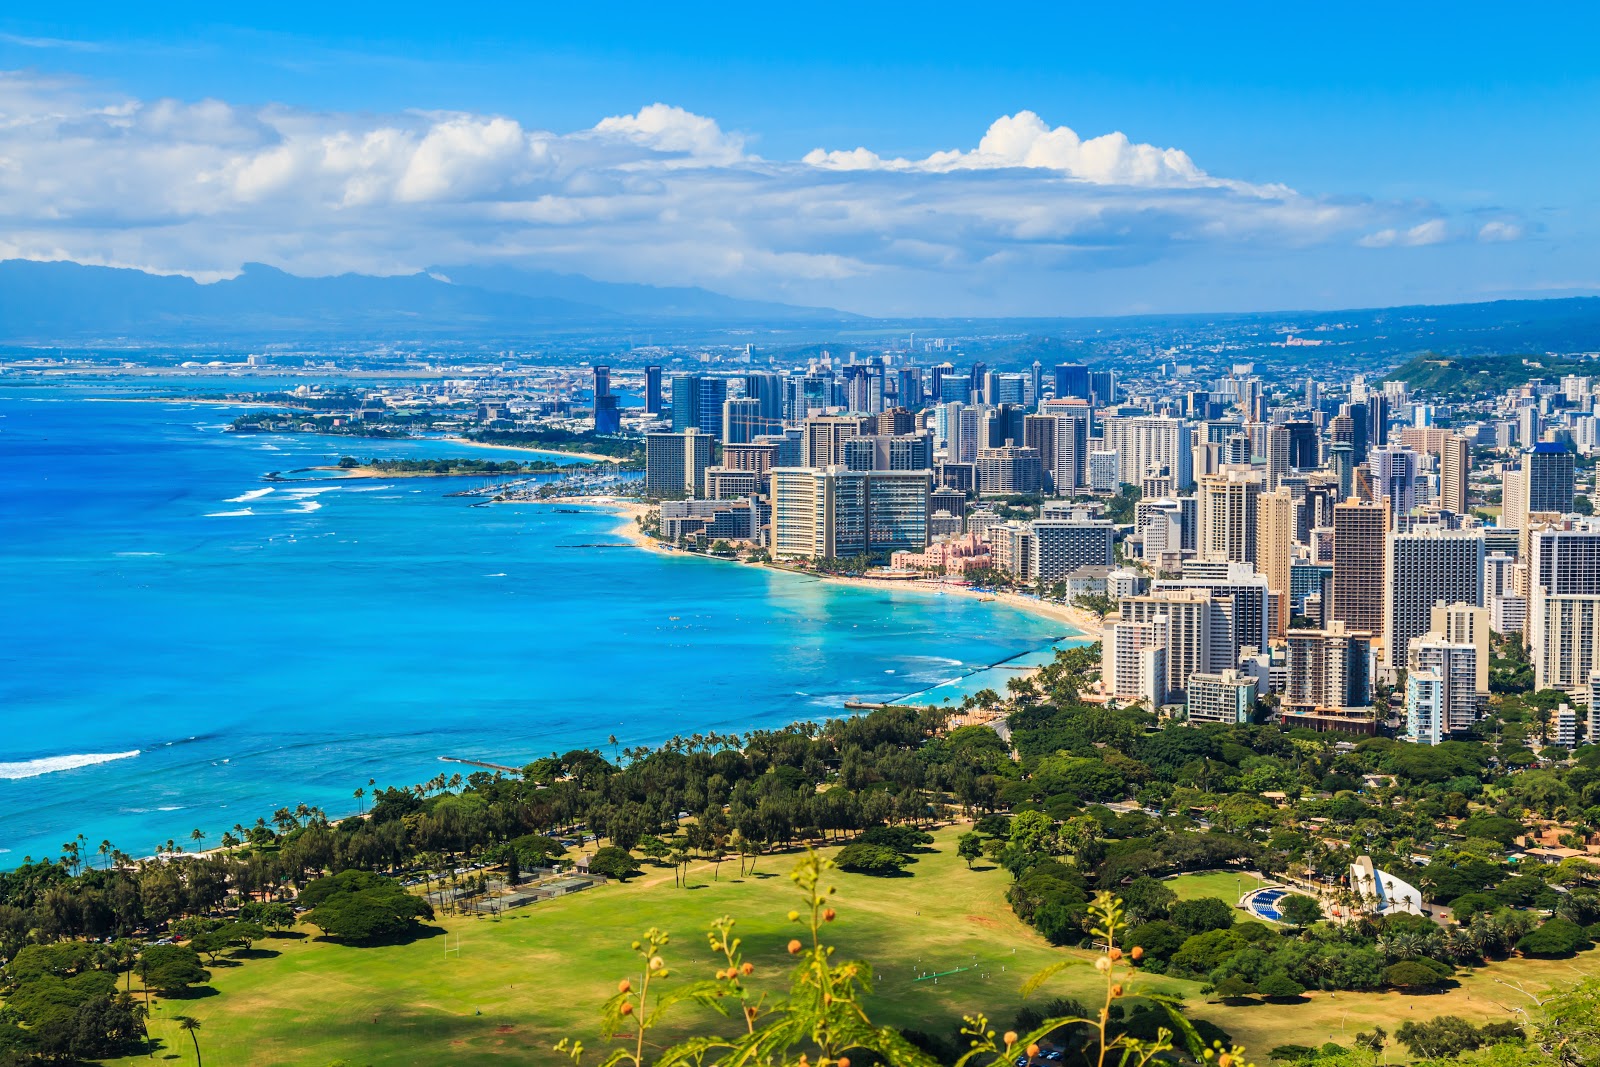
8. Honolulu, Hawaii
- Congestion level: 29%
- Average commute time: 28.7 minutes
- % of commuters using public transit: 8.7%
- % of commuters who walk to work: 5.2%
Honolulu’s crowded freeways are well documented; furthermore, as the most populous city in all of Hawaii, residents have felt the effects of its poor rural roads, too (as previously reported by TRIP). But there might be hope yet for those few public transit riders: the American Public Transportation Association ranks it as a top-10 U.S. transport system, thanks to its efficient “TheBus” and “TheHandi-Van.”
 Credit: Shutterstock / Keep Smiling Photography
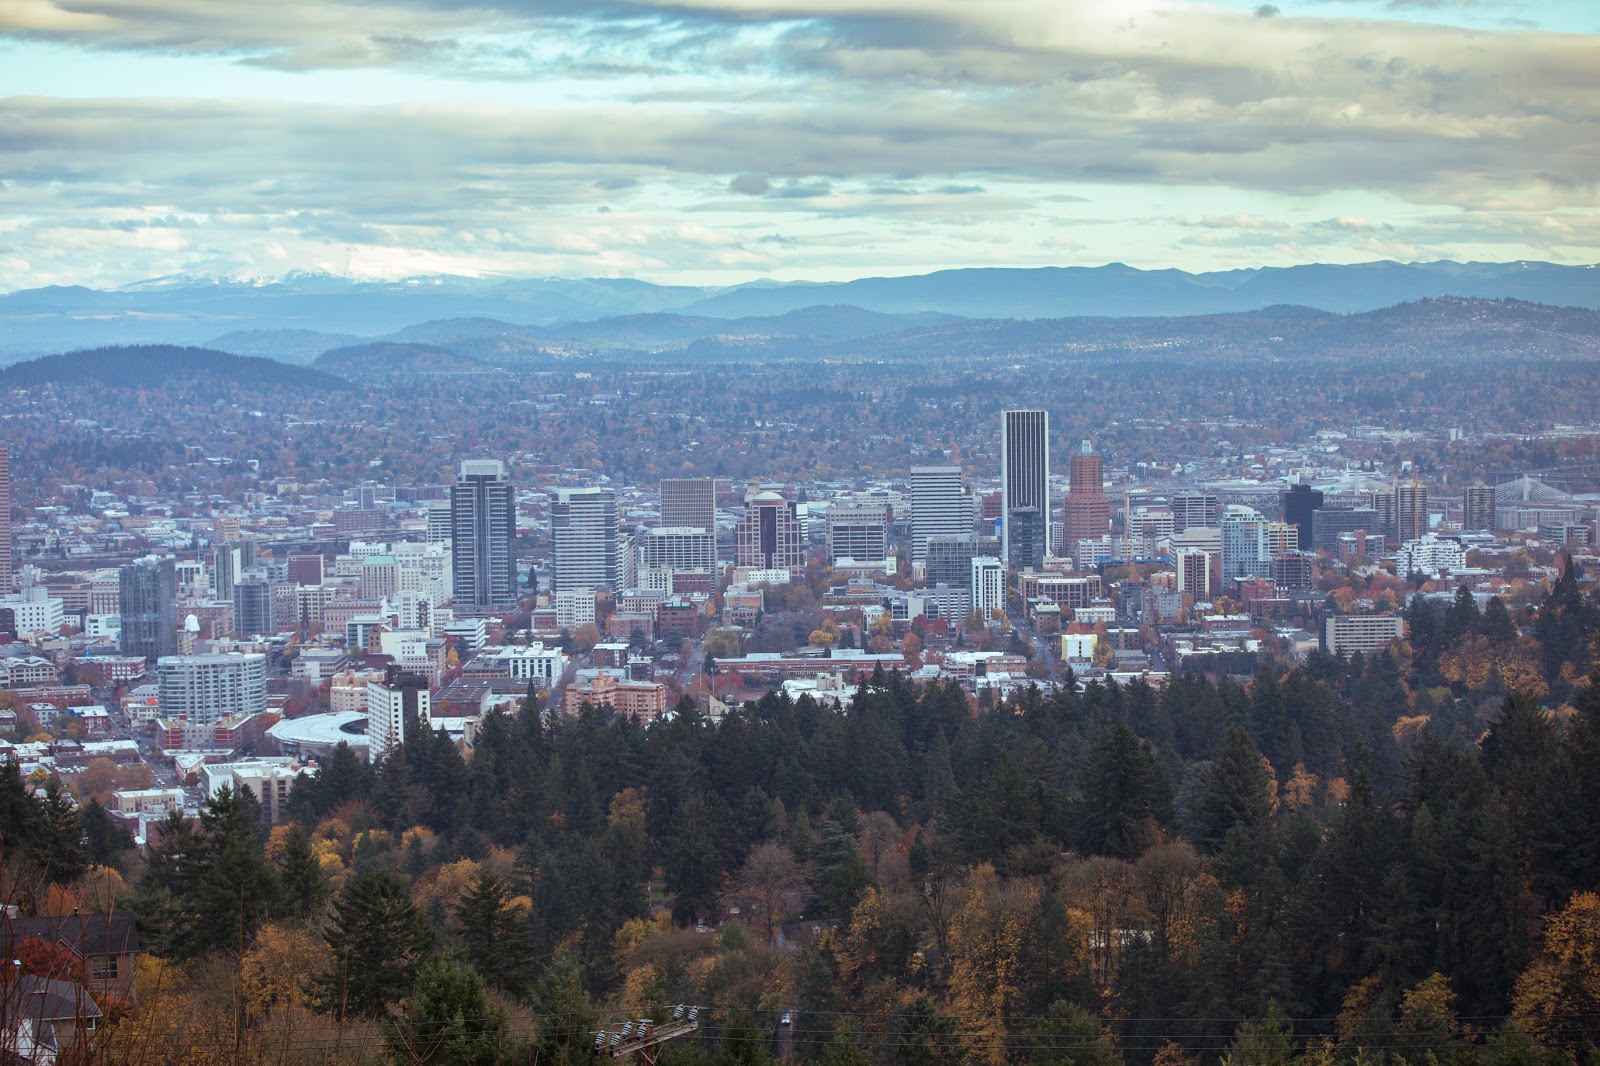
7. Portland, Oregon
- Congestion level: 29%
- Average commute time: 25.6 minutes
- % of commuters using public transit: 12.1%
- % of commuters who walk to work: 6.0%
Bus, light rail, and commuter rail options in Portland abound, but only a little more than a tenth of Portland commuters end up taking advantage of public transit on a daily basis. Portland’s revolutionary light rail system, MAX, was opened in the late 1980s but now faces obsolescence. Its trains only run every half hour or so, and are known to be slower and have insufficient capacity to accommodate regular commuters.
 Credit: Shutterstock / littlenySTOCK
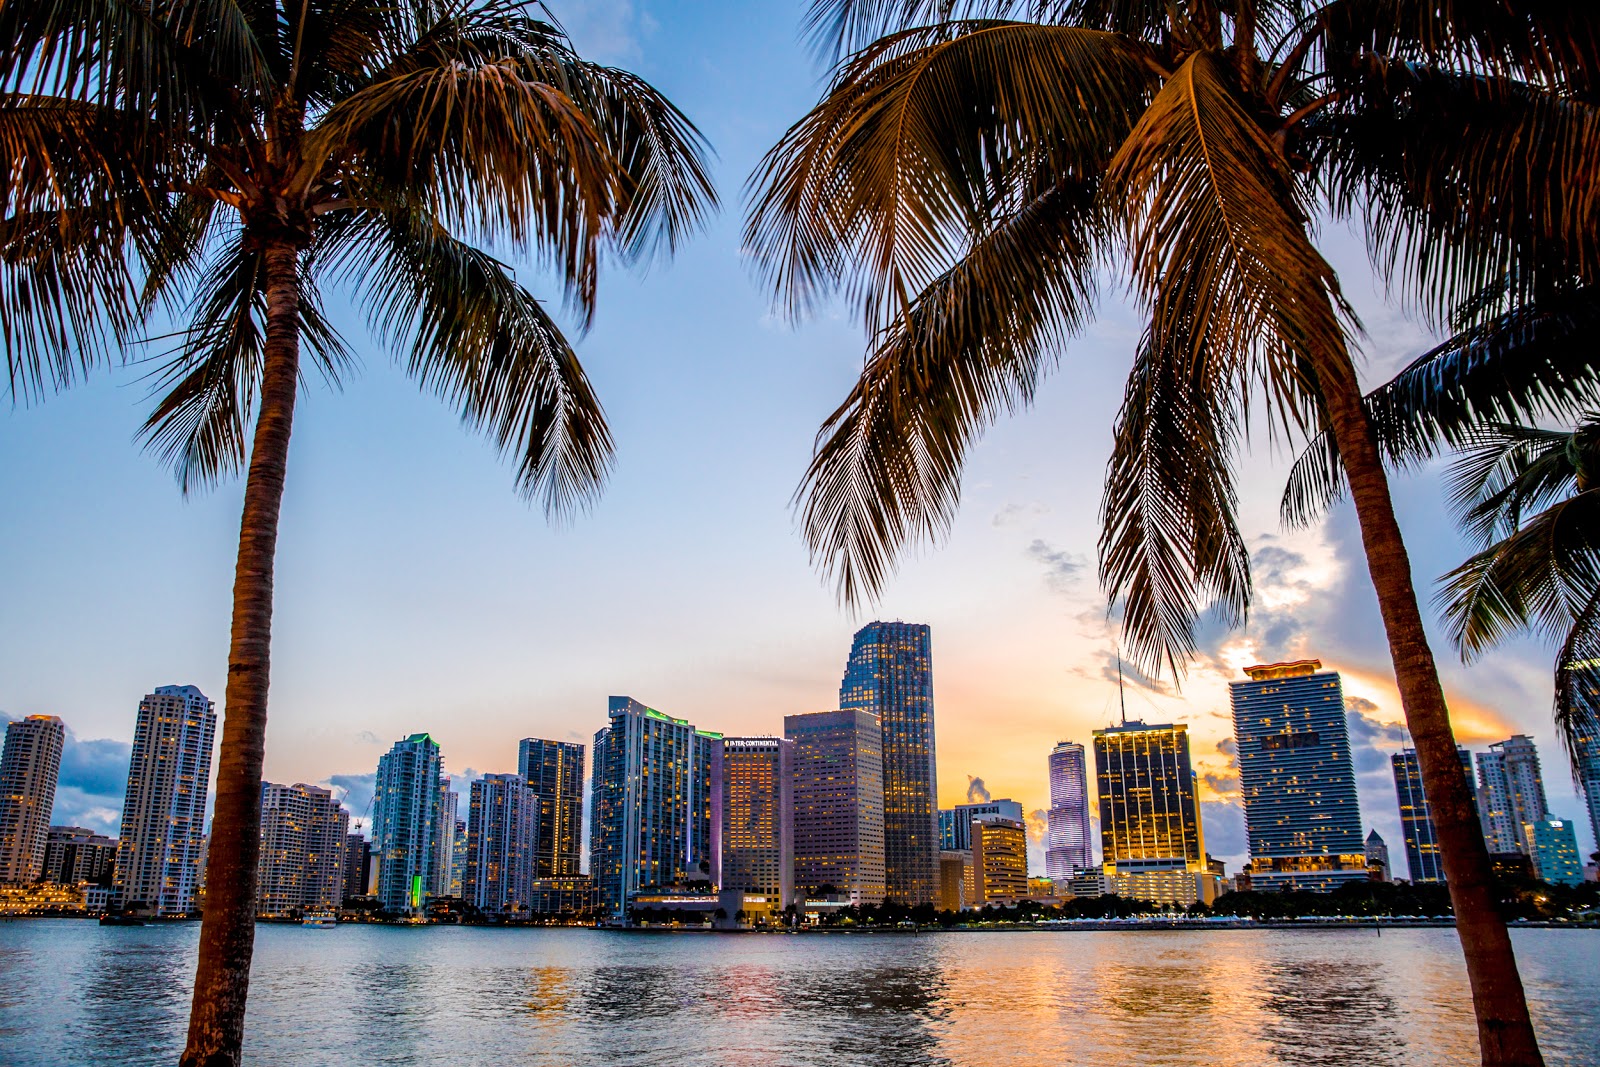
6. Miami, Florida
- Congestion level: 30%
- Average commute time: 27.7 minutes
- % of commuters using public transit: 11.3%
- % of commuters who walk to work: 4.2%
Life’s not always a beach for Miami commuters, who have to deal with the most congested roadways in the American South. South Florida Commuter Services, through Florida’s Department of Transportation, promotes alternative commuting options for Miamians who are seeking ways to get around their traffic woes—while also providing a commuting cost calculator for curious motorists.
 Credit: Shutterstock / Uladzik Kryhin
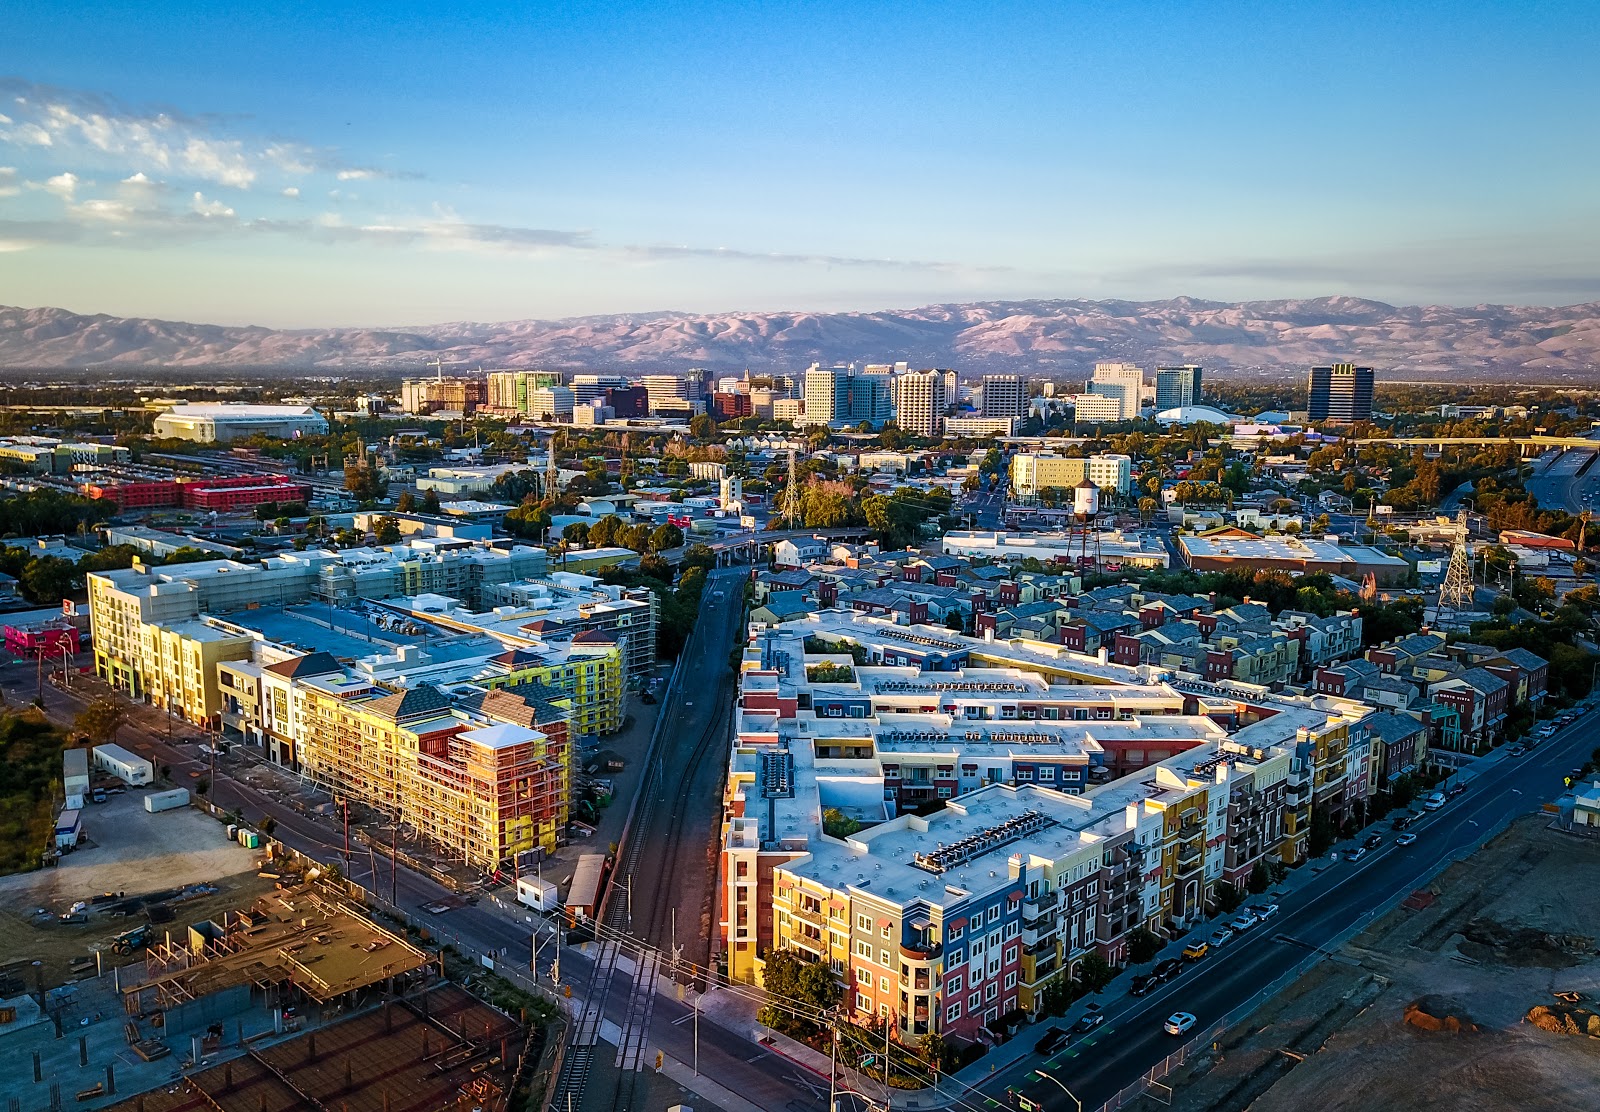
5. San Jose, California
- Congestion level: 32%
- Average commute time: 28.5 minutes
- % of commuters using public transit: 4.2%
- % of commuters who walk to work: 1.7%
A very low number of commuters use public transportation to get to work in this northern California city. Even fewer walk to work—1.7% is the lowest proportion of walkers on this list. That means many have to rely on the roads, which clock in at a 32% congestion level. As a result, increased and more efficient public transportation have become political talking points in this area, which is home to the expensive real estate market of Silicon Valley.
 Credit: Shutterstock / TomKli
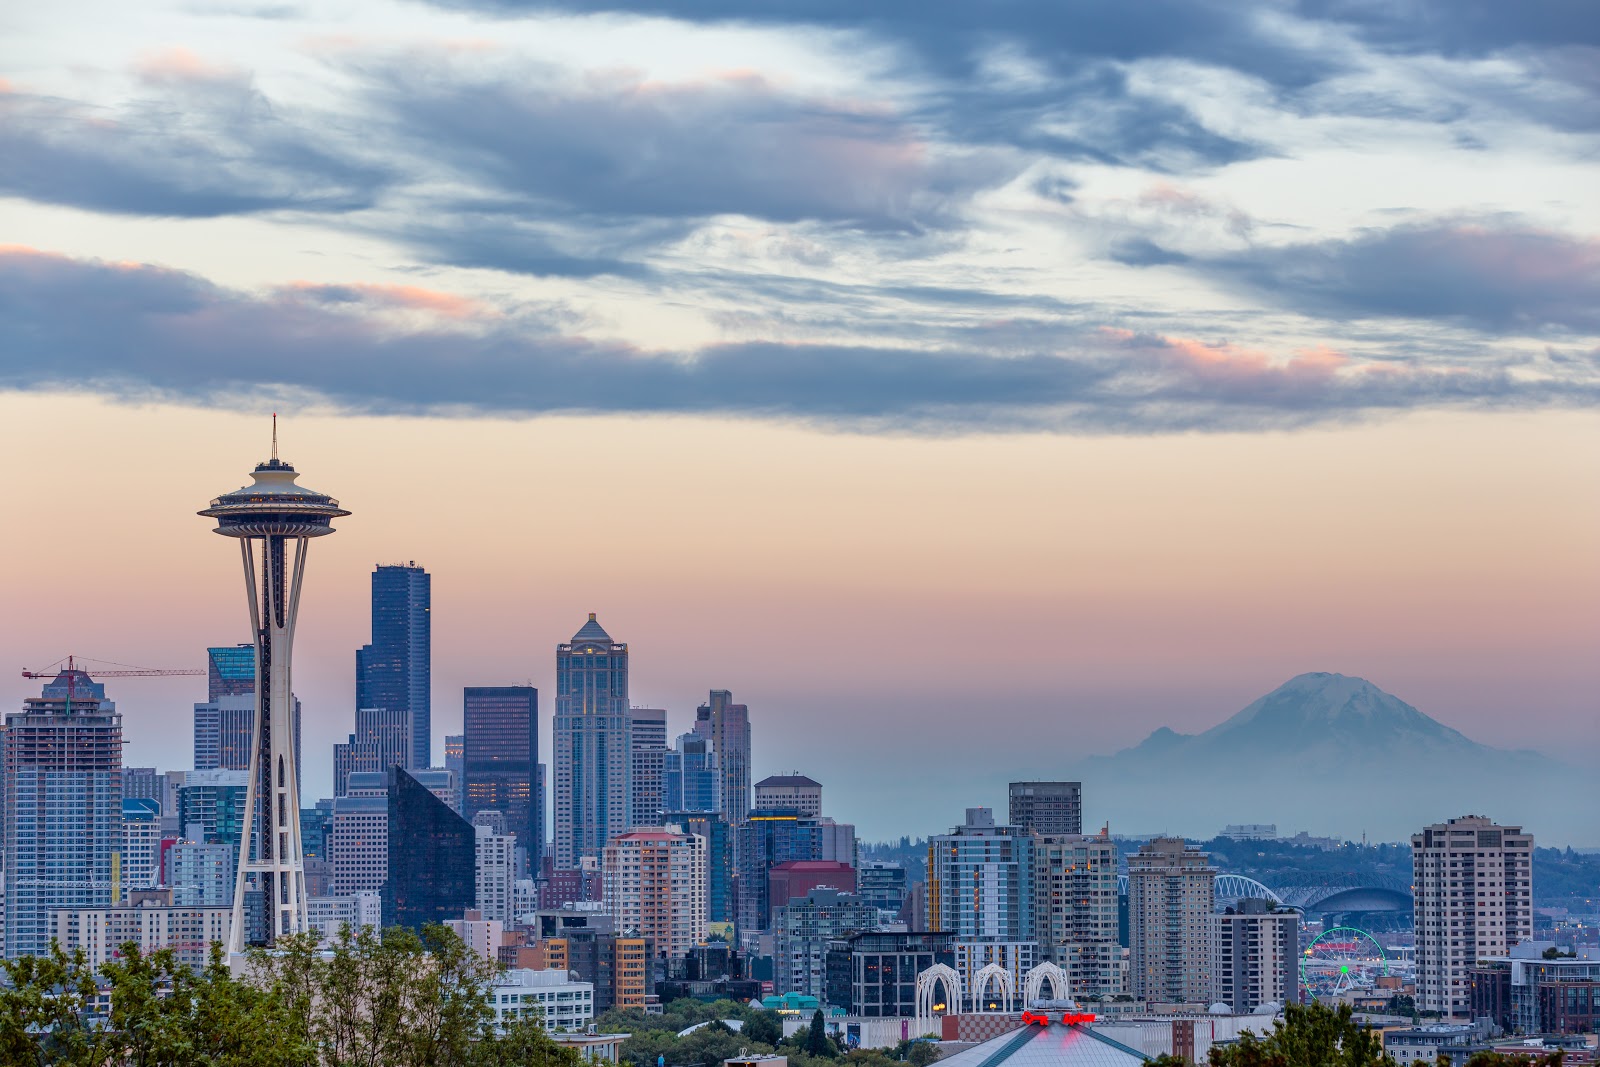
4. Seattle, Washington
- Congestion level: 34%
- Average commute time: 26.9 minutes
- % of commuters using public transit: 20.8%
- % of commuters who walk to work: 10.1%
Facing a congestion level of 34%, Seattle’s commuters must contend with highly populated roads and freeways. Seattle’s public transit options extends out into the city’s suburbs, and apparently is more or less a successful respite from the congested roads: the American Public Transportation Association recently awarded the King County Metro as the top public transit system in the country, based on its safety, maintenance, and efficiency.
 Credit: Shutterstock / ventdusud
3. New York, New York
- Congestion level: 35%
- Average commute time: 40.3 minutes
- % of commuters using public transit: 56.6%
- % of commuters who walk to work: 10.0%
Between taxis, rideshare vehicles, and car-bound commuters, it’s no wonder that Manhattan sees a traffic congestion level of 35%. As over half of NYC commuters use public transit to and from work, the quality, speed, and reliability of the city’s much-maligned subway system have become major talking points in New York’s gubernatorial race. NYC commuters also experience the longest average commutes on this list; though this includes workers who take outbound trains to work, it also speaks to the notorious sluggishness of the subway system.
 Credit: Shutterstock / Travel Stock
2. San Francisco, California
- Congestion level: 39%
- Average commute time: 32.4 minutes
- % of commuters using public transit: 33.6%
- % of commuters who walk to work: 10.6%
A metropolis as densely packed as San Francisco will naturally have some road congestion and a relatively long commute (the second-highest on this list). But many workers have found their way around the traffic. The city’s public transit map is intuitive—albeit complex, with options ranging from the railway to the BART to streetcars to ferries—and the proportion of commuters who walk to work outpaces that of New York City.
 Credit: Shutterstock / Chones
1. Los Angeles, California
- Congestion level: 45%
- Average commute time: 30.5 minutes
- % of commuters using public transit: 10.1%
- % of commuters who walk to work: 3.5%
A city notorious for its sub-optimal traffic conditions, it may come as no surprise that LA is the nation’s highest-ranked city for highway congestion. In fact, the transportation research group TRIP recently reported that Los Angeles roads end up costing each driver about $3,000 per year thanks to costs associated with vehicle operation on deficient roads, lost time, and wasted fuel due to traffic congestion, and traffic accidents. Commuters in the City of Angels have to slog through a half hour commute on average, and public transit is less robust than in other major American cities. But at least the LA Metro system strives to be rider friendly: its website even includes a convenient Commute Cost Calculator.
Commuting Superlatives
Here are the superlative stats for the top 20 cities listed above.
- Highest traffic congestion level: Los Angeles, California (45%)
- Longest average commute time: New York, New York (40.3 minutes)
- Shortest average commute time: Baton Rouge, Louisiana (21.5 minutes)
- Highest % of commuters using public transit: New York, New York (56.6%)
- Lowest % of commuters using public transit: Charleston, South Carolina (1.7%)
- Highest % of commuters who walk to work: Boston, Massachusetts (14.8%)
- Lowest % of commuters who walk to work: San Jose, California (1.7%)
More From TSM Interactive


![Light Up [MARKET NAME] in 2023— Show Us Your Brightest and Most Beautiful Holiday Displays](http://townsquare.media/site/241/files/2020/11/GettyImages-136053602.jpg?w=980&q=75)

